The Social Impact of Big Data, Mapping, and Infographics
The term “big data” is almost ubiquitous these days—as well it should be. Every piece of information we enter into every new app we download, every time we visit a website, use a credit card, check into a hospital, get a grade on a test…it’s a data point, another piece of the great, intangible Big Data cloud that has exploded since the development of the internet. The question is, now that we have all this information, what are we going to do with it?
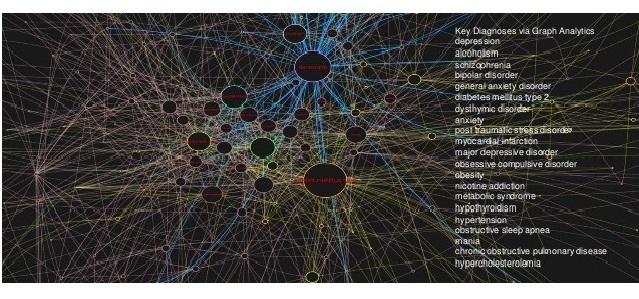
Big Data has huge potential as a tool for social and health improvements. For such a generalized concept, it can be amazingly useful to individual people. Lumiata, which recently presented at the YTH Live panel “Mapping Big Data, Inforgraphics and Other Good Stuff,” leads the field of predictive health analytics with the world’s first comprehensive medical graph. With medical information from hospitals and health care providers around the world, Lumiata helps physicians, insurance companies, and patients build medical histories and predict future health issues.
AIDSvu.org, pronounced “AIDS View,” is another tool for health data analysis. AIDSvu gathers information on HIV/AIDS cases around the country and compiles it into an interactive map of every county in the USA, where the viewer can screen for race, gender, and age, as well as compare it side-by-side with maps of country-wide poverty, education levels, mean household income, income inequality, and number of people without health insurance. The AIDSvu website also provides a search engine for local HIV/AIDS prevention and treatment services.
Where AIDSvu concentrates on a single disease, the Center for Addiction and Mental Health in Toronto, Canada is analyzing data for a specific region. They are coordinating with several local universities in using CrowdMap to create a crowdsourced map of students’ pathways to health, through hospitals, health clinics, exercises and eateries. Soon, Ontarian youth will be able to trace where best to go to attend to their health needs, and local health services how to improve their services, and gaps in the system will be identified and addressed.
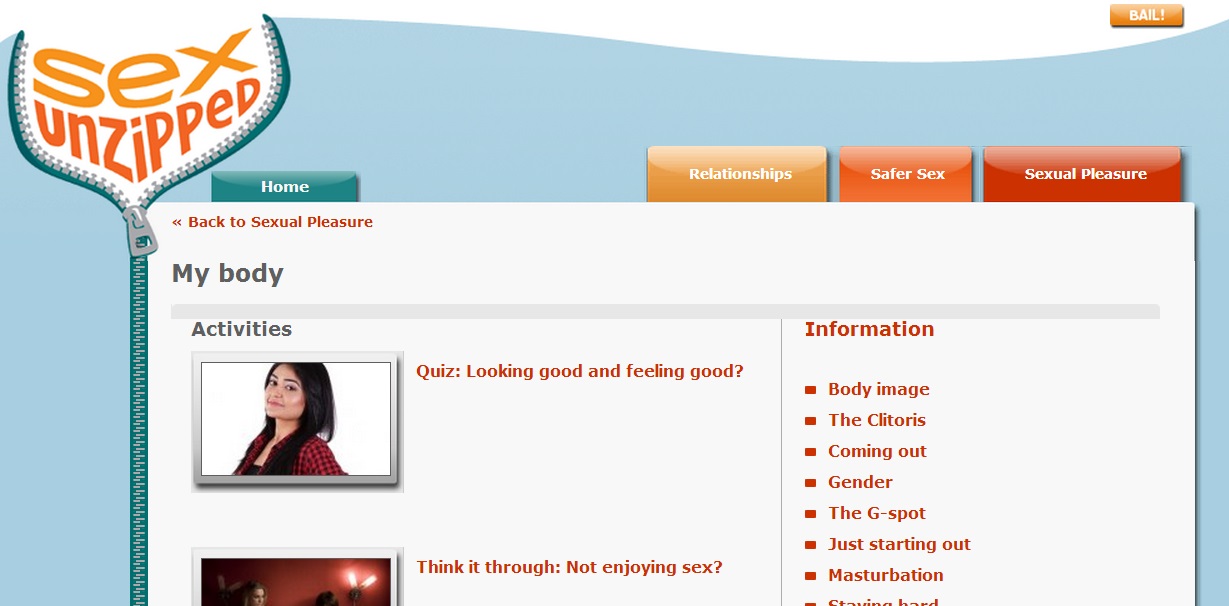
YTH Live featured several other discussions about big data and its uses. At “Advancing Data Collecting Methods,” Tamer Fakhouri of the Yale University of Medicine spoke about gathering data through computer games; Dr. Julia Bailey, from University College London’s e-Health Unit, presented the new SexUnzipped survey and reference website; and Possibilities for Change’s Jennifer Salerno showed off the new Risk Assessment for Adolescent Preventative Services (RAAPS) questionnaire. In the workshop for Exploring, Analyzing and Visualizing Open Health Data on the Web, Clayton Davis of Indiana University showed attendees how his team created and published Kinsey Reporter, a website and mobile app for the anonymous sharing of data on sex.
The term “big data” is often associated with companies like Google and Facebook, and there’s a perception that all they do is hoard it like dragons or sell it to advertisers for nefarious purposes. This is true to an extent, but more information is available to the public than you think, and more is being distilled into graphs, maps and charts every day. AIDSvu and Lumiata are examples of such resources, as are kidsdata.org, PreventConnect, and the Youth Risk Behavior Surveillance System. All you have to do is find the data and act on it.
Subscribe to the YTH Newsletter for updates on health and big data, as well as Like us on Facebook and follow us on Tumblr. Photos credit Lumiata’s YTH Live presentation and the SexUnzipped website.
tags: big data, crowdsourcing, data, health, technology, YTH Live.


